- Overview
- PR Review
- Whitebox Scan
Scan volume
The Scan volume across time widget shows how many scans ran over time as a stacked bar chart. Each bar is one day, split into PR Review and Whitebox Scan counts. Hover a bar to see the per-day breakdown.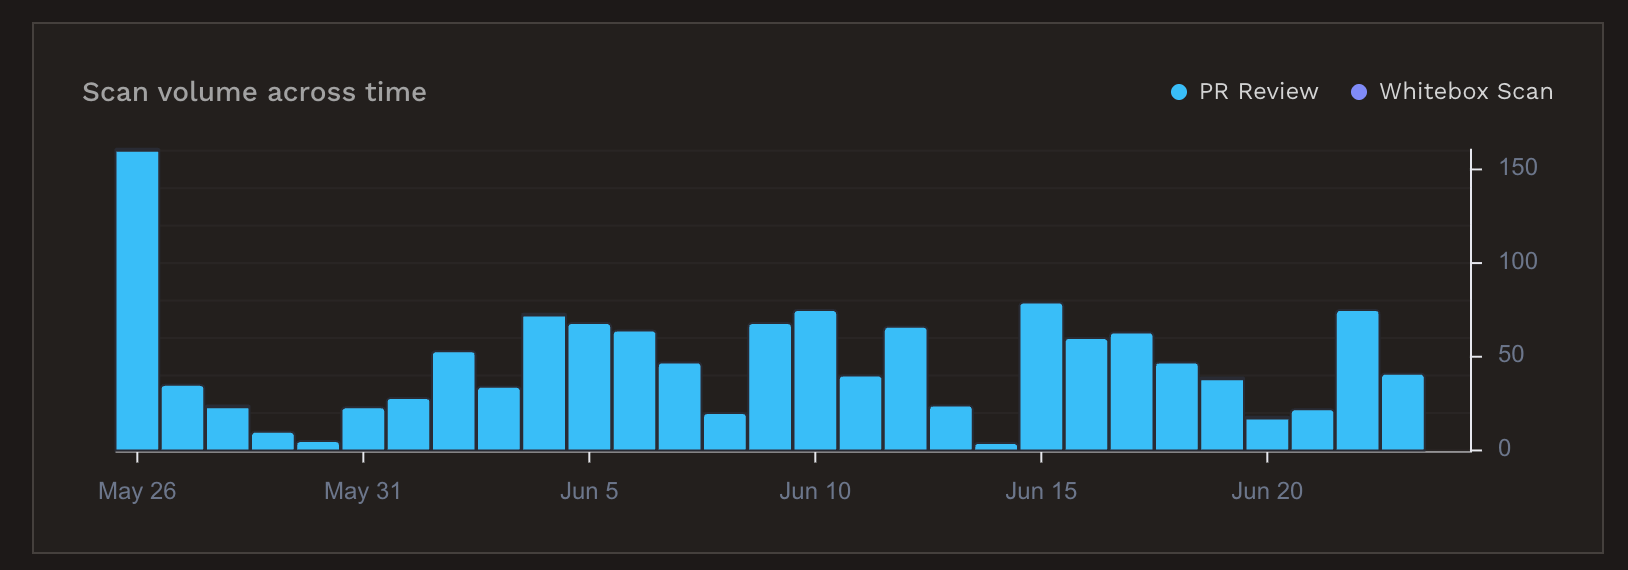
Next steps
Findings and feedback
See where findings are posted and how triage improves reviews.
Whitebox quickstart
Start a whitebox scan from a repository or an uploaded archive.